Assessing farmers’ perceptions of resilience of socio-ecological production landscapes in central and eastern Kenya
22.12.2015
-
SUBMITTED ORGANISATION :
-
Bioversity International
-
DATE OF SUBMISSION :
-
22/12/2015
-
REGION :
-
Eastern Africa
-
COUNTRY :
-
Kenya (East and Central Kenya)
-
SUMMARY :
-
In order to understand farmers’ perceptions of resilience in socio-ecological production landscapes and seascapes (SEPLS), a participatory field assessment was conducted in Kenya. A tool developed by the United Nations University-Institute of Advanced Studies and Bioversity International was used to elucidate the range of perceptions of risk faced by five communities living in different agro-ecological and socio-economic conditions. This paper presents the practical process of carrying out assessments at the community level and also lessons learned while testing the toolkit. The process of using SEPLS indicators was confirmed valuable in: 1) identifying local perceptions of threats in landscape resilience, the perception differences in various community landscapes, major causes of threats and community efforts toward mitigation, 2) improving awareness through stimulating discussions with participants, and 3) providing a perspective on future directions and encouraging local innovations and potential interventions in response to negative trends. The discussions were considered vital in creating social capital for landscape governance, community ownership of the process and identifying potential interventions. A few areas of the tool were found wanting and some amendments have been advanced for consideration.
-
KEYWORD :
-
farmers’ perceptions, resilience indicators, resilience assessment, socio-ecological production landscapes and seascape (SEPLS), Kenya
-
AUTHOR:
-
Yasuyuki Morimoto, Bioversity International; Patrick Maundu, Kenya Resource Centre for Indigenous Knowledge (KENRIK), The National Museums of Kenya (NMK); Dunja Mijatovic, Bioversity International; Nadia Bergamini, Bioversity International; Pablo Eyzaguirre, Bioversity International
Summary Sheet
The summary sheet for this case study is available here.
Introduction
Environmental degradation has a severe impact on how ecosystems function. When an environment is degraded, many of the benefits that ecosystems provide to local communities and agricultural production are also degraded, food security is compromised and resilience is reduced (Deckelbaum et al. 2006 and 2011). Local communities, as the primary managers of the processes and resources of Socio-Ecological Production Landscapes and Seascapes (SEPLS) (Duraiappah et al. 2010), face growing challenges in maintaining these systems, especially in the face of rapid socio-economic changes and increasing uncertainty regarding the natural environment due to climate change and its impacts. Environmental degradation in Kenya is also considered to have multiple causes, including population pressure, unsustainable agricultural and rangeland practices, land fragmentation, poor infrastructure, limited livelihood opportunities and poor knowledge of environmental conservation (Rockstrom 2003, Corvalan et al. 2005, Crona 2006, Roba and Oba 2009, Walingo et al. 2009, Oluoko-Odingo 2010, Combating Desertification in Kenya 2013).
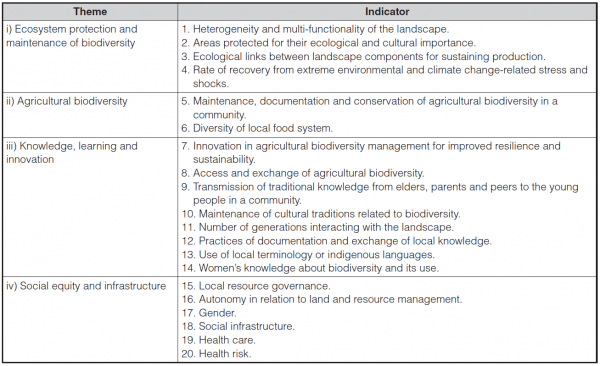
In order to build resilient systems that can mitigate and manage risks, while securing healthy ecosystems and the well-being of local communities, the United Nations University-Institute of Advanced Studies and Bioversity International developed an approach for monitoring and capturing the various aspects that sustain resilient landscapes using specific indicators (van Oudenhoven et al. 2010 a,b, Mijatovic et al. 2012, Indicators of Resilience in Socioecological Production Landscapes 2013). The indicators consist of a set of 20 questions that cut across four main themes: ecosystem protection, biodiversity, knowledge and innovation and social equity and infrastructure.
This paper presents a practical application of SEPLS indicators and experiences and lessons gained in the process. It also presents the results of participatory mapping, Focus Group Discussions (FGD) and data assessment to elucidate farmers’ perceptions regarding the status of SEPLS resilience across different landscapes in the five selected communities in Kenya.
*Note: SEPLS indicators applied in this study are a preliminary version (Indicators of Resilience in Socioecological Production Landscapes 2014) and are slightly different from the latest set of indicators (Toolkit for the Indicators of Resilience in Socioecological Production Landscapes and Seascapes 2014). See Table 2.
Methods
2.1. Assessment workshop
2.1. Assessment workshop
The first exploratory study of the SEPLS assessments, was conducted in five communities in East and Central Kenya (Figure 1) in March 2012. The five were selected on the basis of their long-standing relationship with Bioversity International as well as differences in their socioeconomic pursuits and agro-ecological conditions. In each community, one group of mixed age and gender was chosen for the exercise (Table 1). The participants of each group were identified by a local coordinator and gathered at a central location in the village for a day’s workshop. A community resource mapping exercise was the first activity. The purpose of the mapping was to bring participants to the same level of understanding of their landscape and resources therein. This was followed by the indicators exercise. This involved administering the 20 socio-ecological indicators in the SEPLS toolkit. The indicators are divided into 4 themes: (i) ecosystem protection and maintenance of biodiversity – indicators 1-4, (ii) agricultural biodiversity – indicators 5-6, (iii) knowledge, learning and innovation – indicators 7-14, and (iv) social equity and infrastructure – indicators 15-20 (Table 2). The exercise was concluded with a review of the main problems and threats identified during the exercise, their causes and possible solutions.
Table 1. Location, environmental characteristics and population density of each of the five participating villages and type of participants who attended the Focus Group Discussions (FGD)
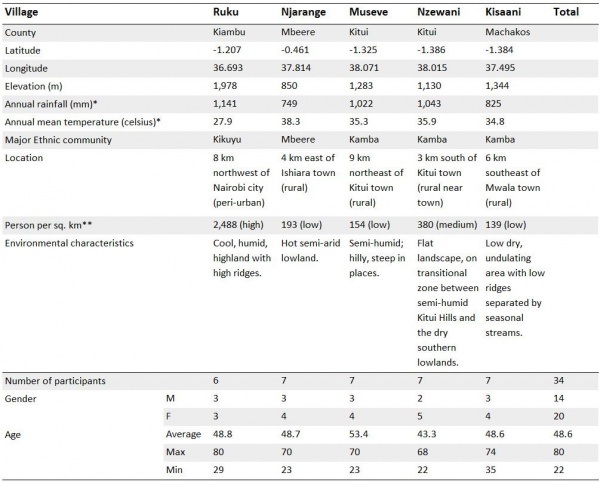
Figure 1. Map of five study communities in East and Central, Kenya. ● shows five studied communities

Table 2. Four themes and 20 indicators for resilience of socio-ecological production landscapes in 2014
Data analysis
The collected score and trend data were subjected to standard statistical analysis. The proportions of respondents giving different score and trend values and mean scores and trends in the five communities were obtained for each of the 20 indicators. An analysis of variance (ANOVA) was conducted with mean scores and trends obtained and pairwise multiple comparisons using Tukey’s multiple range test. In order to understand the major factors contributing to the perception differences among the five communities surveyed, Categorical Principal Component Analysis (CATPCA) (Linting 2007) was conducted to elucidate major variables in score and trend values for each of the 20 indicators. Further, an ordered probit regression model (Hedeker and Gibbons 1994) was used to elucidate the relationships between gender and age of the participants. Each indicator’s score and trend value was used as a dependent variable. Dummy variables were generated for each community (Ruku, Njarange, Museve, Nzewani, and Kisaani) and also for gender (M, F). The generated dummy variables and age scales of the participants were used as covariate variables. R-statistic package 3.0.2 and SPSS 16.0 were used for these assessments.
Results
Introduction/brainstorming session
In each of the five communities, assessment workshops were conducted using the FGD approach. Six to seven participants of mixed gender and age represented each community in the exercise. Each of the six participants was nominated by a much larger group of villagers on the basis of their understanding of the issues in the village and ability to participate. Altogether, 34 individuals participated. The number of participants was kept small for better management of the exercise and to ensure the optimal participation of each individual. The FGD consisted of two parts: the introduction/brainstorming session and the SEPLS indicators/discussion session. One day was dedicated to the FGD in each village. The introduction/brainstorming sessions took about 2 hours. The indicator sessions took about 4-5 hours. This time was needed to cover all 20 SEPLS indicators with discussion at the end to review problems, causes and possible interventions. Opinion leaders were given the chance to contribute their ideas during this time. In each FGD, simple demographic information on the participants such as name, age and gender were recorded at the start of the exercise.
After introductions, the facilitator explained the main objective of the exercise and the programme for the day. A participatory landscape mapping exercise was conducted as the first task in order to familiarize participants with the basic concepts of SEPLS indicators and “resilience of SEPLS”. At the end of the exercise, one participant was requested to present the map and components of the map, including current meeting place, marketplaces, schools, administrative boundaries, infrastructure such as roads, natural features such as rivers, land use and places where key resources were found. Other participants were also invited to add anything that might have been missed. The community map served firstly as a basis for determining the extent of the landscape, secondly to determine the location of major landscape components within the community, and thirdly to bring participants to the same level of understanding of their landscape, its components and the services it offers. The map was also used as a reference during discussions. Mapping was then followed by listing of the major components of the landscape, including crop land, fallow land, wild land and forest. This was followed by listing of agricultural and wild edible biodiversity which included crops and their varieties, edible wild plants and domesticated and wild animals. Major historical events and changes in relation to climate and environment (e.g. droughts) were also discussed and recorded. Key technical terms such as landscape, agrobiodiversity and resilience were also described using local terms. All information was noted down on sheets of paper and pinned on the wall to serve as reference information for participants.
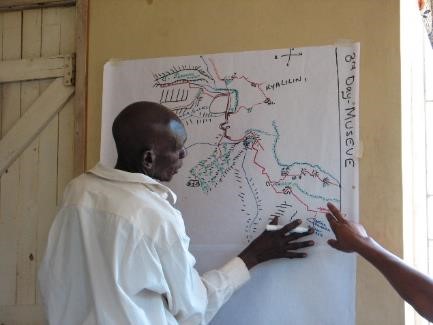
Figure 3 : Participants mapping their landscape. Mapping helps participants to understand their landscape better. After the drawing, the facilitator allowed participants to engage in a discussion about the different natural resources, communal facilities and rights of access or control. Such rights relate to access to forest resources, grazing areas, water sources and some health facilities.
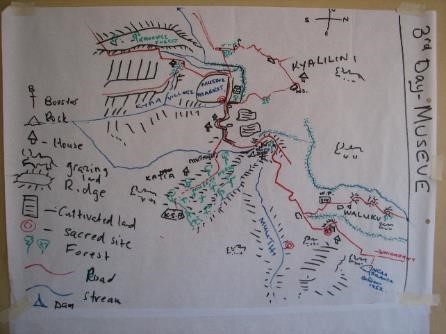
Figure 4 : A section of the Museve location map drawn on paper with the Museve market (1.325 S, 38.071 E, altitude 1,283m) as the main reference point. Two sub-locations (lowest administrative category), and 10 villages were included in the map. The straight line distance between the upper left corner indicated as “Kavonge Forest” and the lower right indicated as “Ngaa dam” is five kilometres, which takes about one hour on foot. The estimated population of the indicated community landscape is 6,400 people representing about 1,100 households. The scale at different parts of the landscape may vary. The sizes of landscapes also varied across the communities surveyed. A tendency for negative correlation was observed between population density and scale of the landscapes.
Indicator session
For each indicator, the facilitator described the indicator’s question and the meaning of each multiple choice answer (five-point scale, 1-5). Scoring a “one” meant the landscape performed very poorly on that particular criterion, and a “five” meant an extremely good performance. Similarly, a five-level scale was used to determine individual perception of trend. A score of “one” meant a steep downward trend, and a “five” meant a steep upward trend. At the end of scoring on each indicator, participants were given the opportunity to discuss their answers. A “consensus” value (collective answer) was then agreed on by the group. Individual answers (each respondent’s score, trend and reason) and collective answers were then recorded separately by the note-taker. In some instances, during the indicator exercise there were some conflicting and/or unexpected results within the same indicator and/or among different ones. This is interpreted as being either due to misunderstanding of the indicator questions (which then meant the question was repeated) or to an inherent problem with the indicator. For example, the original indicator 5, “Maintenance, documentation and conservation of agricultural biodiversity in a community” was separated into two indicators – maintenance and conservation of agricultural biodiversity in a community and documentation of agricultural biodiversity in a community, and renamed 5a and 5b respectively after consultation with the participants. The indicator 5b, “Documentation of agricultural biodiversity in a community” received similar responses to indicator 9, “Transmission of traditional knowledge from elders, parents and peers to the young people in a community” and indicator 10, “Maintenance of cultural traditions related to biodiversity”, as well as indicator 12, “Practice of documentation and exchange of local knowledge”. These indicators elicited similar responses because to many participants, the causes and end results were similar. For each indicator the facilitator had to explain the question using different techniques, including giving examples. A component of indicator 7, “Innovation in agricultural biodiversity management for improved resilience and sustainability”, was not well understood by the participants as their answers tended to focus more on adaptation to introduced practices and technologies (such as the use of chemical fertilizers, pesticides, commercial varieties and agricultural tools, including the ox-plough and drip irrigation) rather than their own innovations that come through trial and error. The term “new” and “old” technology was also found to be relative. It was noticed that the method of scoring the ecosystem status using the 1-5 number system was problematic for some participants. It was also observed that some answers were spontaneously influenced by the composition of the participants, e.g. the presence of an influential person such as a community leader in the discussions. Community expectations such as financial assistance from partners was also found to influence the kind of answers provided. The facilitator, therefore, had to be aware of all these shortcomings and find innovative ways of dealing with each situation.

Figure 5 : Score and trend information collected during FGD in Museve, Kenya.
Data assessment
Through analysing the proportion of respondents that gave a score of 1 (high risk) to 5 (excellent state) for each indicator, areas of risk perception were identified (see Appendix 1, score and trend in percent). Forty one percent (41%) of the total number of respondents found resilience to be in the “medium state” (score 3). However 36% of respondents indicated some level of risk by giving a score of either “high risk” (score 1: 9%) or “risk” (score 2: 27%). More than 50% of respondents indicated either high risk or risk (scores 1 and 2) for seven of the twenty indicators (2, 3, 5b, 6, 12, 15, 20). The largest proportion (94%) was for indicator 5b, “Documentation of agricultural biodiversity in a community”, followed by indicator 2, “Areas protected for their ecological and cultural importance ” (79%), and indicator 20, “Health risk” (65%). Among the four themes, “Agricultural biodiversity” had the highest frequency of risk at 51%, followed by “Ecosystem protection and the maintenance of biodiversity” at 49%.
In trend status, 55% of all respondents indicated an “upward” trend ( ↗ = 4), and 34% indicated a “no change” trend ( → = 3) status. This implies that the resilience of SEPLS was either improving slowly or showing “no change” in their general perception. However, more than 50% of respondents expressed negative changes ( ↓ = 1 and ↘ = 2) for seven indicators (1, 2, 3, 10, 11, 13, 16). The largest proportion (97%) found there to be high risk or risk in indicator 11, “Number of generations interacting with the landscape”. This perception is followed by indicator 13, “Use of local terminology or indigenous languages” (76%) and indicator 10, “Maintenance of cultural traditions related to biodiversity” (71%). Among the four themes, risks of “Ecosystem protection and the maintenance of biodiversity” was the highest at 49% and “Knowledge, learning and innovation” followed at 40%. Indicator 2, “Areas protected for their ecological and cultural importance” and indicator 3, “Ecological links between landscape compornents for sustaining production” showed negative scores for both current status and future trends.
These risk perceptions, including causal problems and challenges experienced, were well articulated during the discussions for each indicator. Key issues identified for each indicator theme are summarized below.
i) Ecosystem protection and the maintenance of biodiversity- Indicators 1-4.
- Environmental degradation was highlighted in all communities surveyed and almost exclusively linked to rapid population increase and the attendant increased demand for resources (agricultural land, firewood, construction material, charcoal, animal food and wood for carving). Deforestation is resulting in floods, low ground water, smaller farm size, overgrazing, and loss of wildlife and other forms of biodiversity. Participants of the Museve and Kisaani communities pointed out that they used to have many traditional fruits and medicinal plants in the forest, however many of these have been lost and now they have to depend on cultivated crops and outside resources.
- Government policy support was articulated as generally weak in ecosystem protection, maintenance of biodiversity and documentation of traditional knowledge and cultural values. Participants also expressed weakness in traditional institutions.
ii) Agricultural biodiversity – Indicators 5-6.
- Participants articulated erosion of crop diversity and associated knowledge. There is social and economic pressure to plant a few commercially successful crops such as maize and beans and to expand crop fields. Participants said that loss of plant species was concomitant with loss of indigenous knowledge including local recipes (e.g. how to mix various vegetables) and general plant use. Other issues were limited access to pastures and farmers not being able to have large numbers of diverse animals.
iii) Knowledge, learning and innovation – Indicators 7-14.
- In general, none of the communities are making efforts to document local knowledge. Most of the knowledge on agrobiodiversity, ecosystems and culture is passed down through oral tradition. It has not been used for school education and is therefore threatened. Participants said that this is a contributing factor to poor governance of local resources, as it is influencing the younger generation to disregard local traditions. Also contributing were the decline of interaction between different generations and erosion of indigenous languages.
iv) Social equity and infrastructure – Indicators 15-20.
- The government’s commitment was observed in social infrastructure and health care. A high percentage of respondents expressed “upward” and “steep upward” trends in this area.
- Participants also expressed risk due to changes in social behaviour. They said that it is due to lack of local industries and widespread unemployment of the youth, increasing the rate of young people migrating to cities for jobs. The youth are increasingly living away from their communities and hence have fewer opportunities to interact with elderly people. The youth depend more on knowledge brought from outside by the media and city people.
Differences in risk perceptions among the communities surveyed
Significant differences between the communities were observed in all indicators with the exceptions of three indicators (1, 5b, 17) in scores and three indicators (11, 17, 19) in trends (Appendix 1, mean score and trend). In general, the Njarange community showed negative perceptions in both total mean score and trend (both at 2.7), indicating they have the highest risks in resilience of their socio-ecological production landscapes among the communities surveyed.
Correlation coefficients among the quantitative traits were calculated for a total of 42 indicators (indicator 5 is separated in 2 different indicators 5a and 5b, and 21 indicators each for score and trend) and the first and fourth principal factor loadings and their contributions are shown in Appendix 2.
Principal Component (PC) 1 had a large positive integrated score for indicators 6, 7, 8, 13, 18, 19, 20 (29.2% of the total variance) showing that this community has optimistic perception of their infrastructure conditions (e.g. markets, roads, telecommunication, electricity and public health care facilities), access to diverse locally produced foods, income generation opportunities including high value horticultural crop production with innovative farm management technologies and practices such as use of greenhouses and drip irrigation, and good animal breed-based enterprises. This integrated component was considered most characteristic of the “peri-urban” landscape and Ruku community. Ruku community characterized by good accessibility and the influence of Nairobi city. Despite positive trends in the area of infrastructure, the participants of Ruku recognized current risks associated with the expansion of Nairobi city, leading to high land pressure due to population growth, less land for animal keeping, small crop fields and reduced crop species, as well as new health problems such as HIV, alcoholism, drug abuse, obesity and new socially unacceptable practices including crime, terrorist attacks and poor social cohesion at the community level.
PC2 was characterized by strong negative trends for indicators 4, 5a, 6, 8, 15 and 20, as concerns recovery from environmental and climate stresses, maintenance of agricultural biodiversity, access to diversity of local food systems, local resource governance and health conditions. This integrated component (20.4% of the total variance) was considered characteristic of the “dry-land and isolated” landscape and Njarange community. Njarange community highlighted uncertainties of rainfall, fragile environments, limited food production and natural resources, poor access to markets and local resource management due to the dry weather and remote nature (mainly due to poor road infrastructure) of the landscape. Njarange participants expressed strong risk perceptions caused by decreased rainfall, frequent droughts (shorter rainy season, longer dry season) contributing to the current low harvests. Villagers are therefore forced to depend highly on external food and inputs such as seed. Opportunities for income are limited, leading to locals selling natural resources such as sand and charcoal and thus contributing to land degradation. Participants in Njarange also said that they used to keep animals to complement their agriculture and secure their livelihoods. However, they explained that the government had organized a national land demarcation programme in the 70’s, subdividing the land into small uneconomical parcels. Access to communal property such as grazing land and sacred sites was limited at the same time.
PC3 is characterized by integrated positive perceptions of trends of ecosystem protection, cultural traditions related to biodiversity and a positive score for autonomous access to land and resource management (positive score on indicator 16 and trends in indicators 2 and 10). This integrated component was considered to represent the “cultural landscape and ecosystem maintenance”, reflecting community efforts in ecosystem protection through cultural knowledge documentation and the transmission initiative that the Nzewani community has been implementing. The Nzewani community showed less perception of risks in terms of ecosystem protection, maintenance of biodiversity and conservation of cultural components compared with the other communities (See mean scores in indicators 5b, 12 and mean trends in indicators 1, 2, 3 and 10 in Appendix 1).
Perception differences in sociodemographic variables (gender and age factors)
There was some level of significance observed in the Age scores with indicator 11 (coefficient estimates 0.12, standard error 0.42, p=0.005), and 17 (coefficient estimates 0.05, standard error 0.02, p=0.009), showing that the younger generation, more so than older generations, recognized that women are more involved in community decision-making processes and have improved access to resources and education, as well as recognized the existence of opportunities for innovation. Similar observation was also noted in gender scores with indicator 9 (coefficient estimates -1.21, standard error 0.52, p=0.019) showing that women recognized that traditional knowledge such as preparing traditional foods is now being passed to the younger generation, while men felt that the knowledge was mainly confined to the elderly generation.
Potential local solutions and interventions for improving SEPLS resilience
- Areas for potential community-based interventions were identified and key community recommendations are summarized below. The process of discussion for each indicator was identified as an essential element in creating social capital for landscape governance, community ownership of the process and improving awareness, providing a perspective on future directions and encouraging local innovations and actions in response to negative trends.
- Restoring the ecosystem through community empowerment in training and mobilizing community groups, facilitating strong community participation (e.g. of youth and women groups) in practical traditional knowledge documentation and preservation. These activities need to be recognized by the communities and integrated as part of their routine work. The participants articulated a need for government and/or partner institutions to provide support in this area through integration with on-going education programmes.
- Awareness creation for all stakeholder organizations. Local participation is considered important to create opportunities for dialogue and social cohesion among relevant local organizations and stakeholders, and to achieve ecosystem conservation, sustainable local resource governance and management of use and maintenance of biodiversity and important cultural landscapes at the community level. The strengthening of local networking and good leadership were considered important in enforcing relevant government regulations and policies and providing communities with an edge when negotiating for development projects.
- Demonstrating benefits of conservation due to ecosystem services and biodiversity. Benefits include incomes from agrobiodiversity, mitigating risks of crop failure and recipes of local foods and nutritional benefits. Technical innovations and intensified research are needed in these areas to establish new products with enhanced economic and nutritional value. This would help increase production levels of locally produced food crops.
- Technical assistance in resource use and management. This assistance could be carried out in the areas of soil conservation, new crop varieties, irrigation, use of manure, e.g. cow dung, composting, marketing, agricultural equipment, beekeeping, energy-saving stoves, use of cover crops, mulching and legumes to improve/preserve soil fertility.
Experience and lessons learned in testing the SEPLS indicator tool
- A group of 6-7 participants was found appropriate for managing and facilitating discussions but insufficient for statistical data assessment of the scores. However, the discussion among community members was a fundamental element of this exercise, and the documentation of comments and exploration of development directions required a lot of time. The research team and facilitator of the discussions therefore need to strike the right balance between the two and identify the ideal number of participants for this exercise. A larger number of participants would require more time. Approximately 20-25 active participants is probably the maximum number that one facilitator can handle. If two facilitators and note takers are available, two parallel discussions can be held with different gender groups.
- For comparison purposes, target study communities need to be identified strategically taking into consideration the climatic, geographical (e.g. distance to the markets or towns, altitude), and socio-cultural characteristics of the community.
- The score and trend data are based on the subjective judgment of the participants based on observation and experience. It was considered important to understand their interpretations, the underlying facts impacting their perceptions, rather than merely recording the data of the symptoms. This understanding can be managed by creating more time for discussions (e.g. having two to three-day meetings instead of one-day), adopting several other participatory methods (Schmeer 1999, Grum et al. 2008, Regmi et al. 2010, Van de Gevel et al. 2014) in the pre-survey interactions and brainstorming sessions, and conducting post-survey interviews and literature reviews. Cross-verification from two or more information sources was considered essential.
- Periodic use of these indicators is also considered helpful, not only for validating the information but also enabling evaluation of perception changes, progress towards the project management objectives, enhancing cooperation among all stakeholders by implementing the local innovation and identifying adaptive management actions addressed by participants as well as potential local partner institutions.
- The indicators and questions need tailor-made modifications depending on local contexts and type of FGD participants, e.g. community representatives, local and national stakeholders. The process of sharpening indicators will be only possible through field testing in the target communities.
- Training facilitators is considered important in order to minimize variations caused by the way questions are administered to participants. Trainers need to be trained through a learning-by-doing approach in a participatory manner. There is also a need for capacity development to enhance the use of the tool by local communities, NGOs, development workers, policymakers, and project planners for monitoring and evaluation purposes. Training local school teachers on the use of the tool may facilitate more ownership of the process by the communities themselves.
Conclusion
Through the above exercise, the SEPLS assessment was confirmed valuable in: 1) identifying local perceptions of threats in landscape resilience, perception differences in various community landscapes, major causes of threats and community efforts toward mitigation, 2) improving awareness through stimulating discussions with participants, and 3) providing perspectives on future directions and encouraging local innovations and potential interventions in response to negative trends. The discussions were considered vital in creating social capital for landscape governance, community ownership of the process and identifying potential interventions. Identified solutions and recommendations should be maintained within communities and followed through based on enhanced cooperation among community stakeholders that would then develop an implementation strategy for the proposed interventions through a coordinating body or committee. With time, this indicator survey would need to move the focus from understanding the status of community resilience to research aimed at understanding the sustainable use of outcomes (incomes, dietary patterns, and knowledge of the local foods) of the interventions and the dynamic process, if any, of maintaining local crop and production landscape diversity.
References
Cabell, J. F., and M. Oelofse. 2012. An indicator framework for assessing agroecosystem resilience. Ecology and Society 17(1): 18.
Combating Desertification in Kenya: Emerging Lessons from Empowering Local Communities 2013. United Nations Development Programme (UNDP). Nairobi. Kenya.
Corvalan C., Hales. S, McMichael A. 2005. Ecosystems and human well-being: health synthesis. A report of the Millennium Ecosystem Assessment. World Health Organization. Geneva 27, Switzerland.
Crona, I. 2006. Supporting and enhancing development of heterogeneous ecological knowledge among resource users in a Kenyan seascape. Ecology and Society 11(1): 32.
Deckelbaum, R.J., Palm, C., Mutuo, P., and DeClerck, F. 2006. Econutrition: Implementation models from the Millennium Villages Project in Africa. Food and Nutrition Bulletin, vol 27, no 4, pp.335–342.
Deckelbaum, R.J. 2011. Econutrition: Integrating food-based human nutrition with ecology and agrodiversity preface. Food and Nutrition Bulletin, vol 32, no 1, p.S3.
Duraiappah, A., K. Nakamura, K. Takeuchi, M. Watanabe and M. Nishi (2010). Satoyama-Satoumi Ecosystems and Human Well-being: Assessing Trends to Rethink a Sustainable Future. United Nations University Policy Brief, Number 7, United Nations University, Tokyo, Japan.
Grum, M., Gyasi, E.A., Osei, C., Kranjac-Berisavljevic, G. 2008. Evaluation of best practices for landrace conservation: Farmer evaluation. Bioversity International, Rome, Italy. 20 pp.
Gu, H. and Subramanian S.M. 2012. Socio-ecological production landscapes: relevance to the green economy agenda. United Nations University Institute of Advanced Studies Policy Report. United Nations University Institute of Advanced Studies. Yokohama, Japan. <http://archive.ias.unu.edu/resource_centre/Socio-ecological%20Production%20Landscapes.pdf>
Health-risk perception in the inner city community of Centro Habana, Cuba. International Journal Occupational and Environment Health 2000. 6:34-43.
Hedeker D. and Gibbons D.R. (1994). A Random-Effects Ordinal Regression Model for Multilevel Analysis. Biometrics. Vol. 50, No. 4, pp. 933-944.
Indicators of Resilience in Socioecological Production Landscapes (SEPLs) 2013. United Nations University. <http://archive.ias.unu.edu/resource_centre/Indicators-of-resilience-in-sepls_ev.pdf>.
Indicators of Resilience in Socioecological Production Landscapes (SEPLs) 2014. Satoyama-initiative. <http://resilience2014.sciencesconf.org/file/45695>
Linting M., Meulman J.J., Groenen, P.J.F., and Van der Kooij, A.J. (2007). Nonlinear principal components analysis: Introduction and application. Psychological Methods. Sep;12(3):336-58.
Mijatovic, D., van Oudenhoven, F., Eyzaguirre, P.B. and Hodgkin. T. 2012. The role of agricultural biodiversity in strengthening resilience to climate change: towards an analytical framework. International Journal of Agricultural Sustainability, published online (June 2012), Available at: <http://www.tandfonline.com/doi/abs/10.1080/14735903.2012.691221>.
Morimoto Y. 2010. Countering local knowledge loss and landrace extinction in Kenya: The case of the bottle gourd (Lagenaria siceraria). Case 37. Biocultural Diversity Conservation. Global Source Book. Edits: L.Maffi and E.Woodley. Earthscan Publications Ltd.
Oluoko-Odingo A. 2011. Vulnerability and Adaptation to Food Insecurity and Poverty in Kenya. Annals of the Association of American Geographers, 101:1, pp.1-20.
Regmi R.B., Morcrette A., Paudyal A., Bastakoti R., Pradhan S. 2010. Participatory Tools and Techniques for Assessing Climate Change Impacts and Exploring Adaptation Options. A Community Based Tool Kit for Practitioners. Livelihoods and Forestry Programme (LFP), DFID-Nepal. 58p.
Roba G.H and Oba G. 2009. Efficacy of Integrating Herder Knowledge and Ecological Methods for Monitoring Rangeland Degradation in Northern Kenya. Human Ecology. 37: pp.589–612
Rockstrom J. 2003. Resilience building and water demand management for drought mitigation. Physics and Chemistry of the Earth 28. pp. 869–877.
Schmeer K. 1999. Guidelines for Conducting a Stakeholder Analysis. Bethesda, MD: Partnerships for Health Reform, Abt Associates Inc. 42p.
Toolkit for the Indicators of Resilience in Socio-ecological Production Landscapes and Seascapes (SEPLS) 2014. UNU-IAS, Bioversity International, IGES and UNDP. <https://satoyama-initiative.org/old/en/publication-toolkit-for-the-indicators-of-resilience-in-socio-ecological-production-landscapes-and-seascapes-sepls/>
Van de Gevel J, Bijdevaate M, Mwenda P, Morimoto Y, and Fadda F. 2014. Guiding focus group discussions on varietal diversification and adaptation to climate change in East Africa. Bioversity International. 26p.
Van Oudenhoven, F., Mijatovic, D. and Eyzaguirre, P., 2010a. Social-ecological indicators of resilience in agrarian and natural landscapes, Management of Environmental Quality: An International Journal, 22(2), pp.154–173.
Van Oudenhoven, F., Mijatovic, D. and Eyzaguirre, P., 2010b. Bridging Managed and Natural Landscapes. The role of traditional agriculture in maintaining the diversity and resilience of social-ecological systems. Sustainable Use of Biological Diversity in Socio-Ecological Production Landscapes: Background to the ‘Satoyama’ Initiative for the Benefit of Biodiversity and Human Well-Being. CBD Technical Series no. 52. pp. 8-21.
Walingo M, Liwenga E, Kangalawe R, Madulu N, Kabumbuli R., 2009. Perceived impact of and use changes and livelihood diversification strategies of communities in the Lake Victoria Basin of Kenya. Journal of Agricultural Biotechnology and Sustainable Development Vol. 1(3) pp.69-78.
Appendices
Appendix 1. Percentages of respondents in different perception score and trend, and mean scores and trends for the 20 indicators in the five communities studied in Kenya.
* Different alphabets indicate different means at 5% significant level by the Tukey’s multiple range test.
Score: 1 (high risk), 2 (risk), 3 (medium state), 4 (good state), 5 (excellent state)
Trend: ↓ (1: high downward trend), ↘ (2: downward trend), → (3: no change), ↗ (4: upward trend), ↑(5: high upward trend).
Appendix 2: The first to forth principal factor loadings obtained by Categorical Principal Component Analysis (CATPCA).
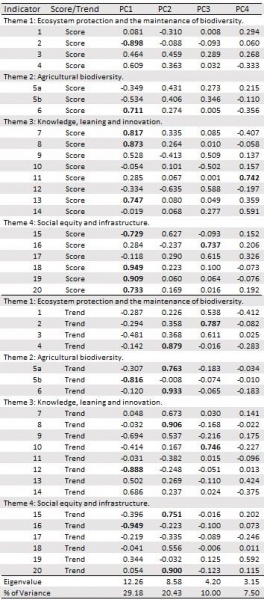
Factor loading larger than 0.7 are shown in bold and these indicators are highly correlated with each other. The cumulative contribution of the first to fourth components was 67.1%.